The Complete Beginner's Guide to Google Lighthouse: How to Make Your Website Super Fast
Introduction: Why Does Website Speed Matter So Much?
Imagine you are waiting for your favorite video game to load. If it takes 10 seconds, you might get bored and go play something else. Websites work the exact same way. When people visit a website and it takes too long to load, they leave and never come back.

This is a huge problem for people who own websites. Every second that a website is slow costs them real money. Here is why:
When someone clicks on a website and has to wait, they get frustrated. Studies show that if a website takes just one extra second to load, about 7 out of every 100 people who were going to buy something will leave without buying. That might not sound like a lot, but if you have 10,000 visitors a day, that means you lose 700 potential customers every single day just because your site is slow.
Google also cares deeply about website speed. Google wants to show people the best websites, and part of being the best means being fast. If your website is slow, Google will show your competitors' websites instead of yours. This means fewer people will even find your website in the first place.
But it's not just humans and Google anymore. LLMs (Large Language Models) like ChatGPT, Claude, and Gemini also depend on fast, high-quality websites. These AI models learn from the information they find on the internet. If your website loads slowly, performs poorly, or ranks on page 50 of Google, LLMs are far less likely to crawl or learn from it. That means your website won't show up in AI-generated answers, AI search results, or tools that pull data from LLMs.
Think about it this way: If your site is buried on page 100, the chances of an LLM ever noticing your content are basically zero. And as AI becomes a major way people discover information, this matters more than ever.

So improving your website's speed doesn’t just help you get more human visitors—it helps your content stay visible in the world of AI, where being included in LLM training and retrieval means more exposure, more trust, and more long-term traffic.
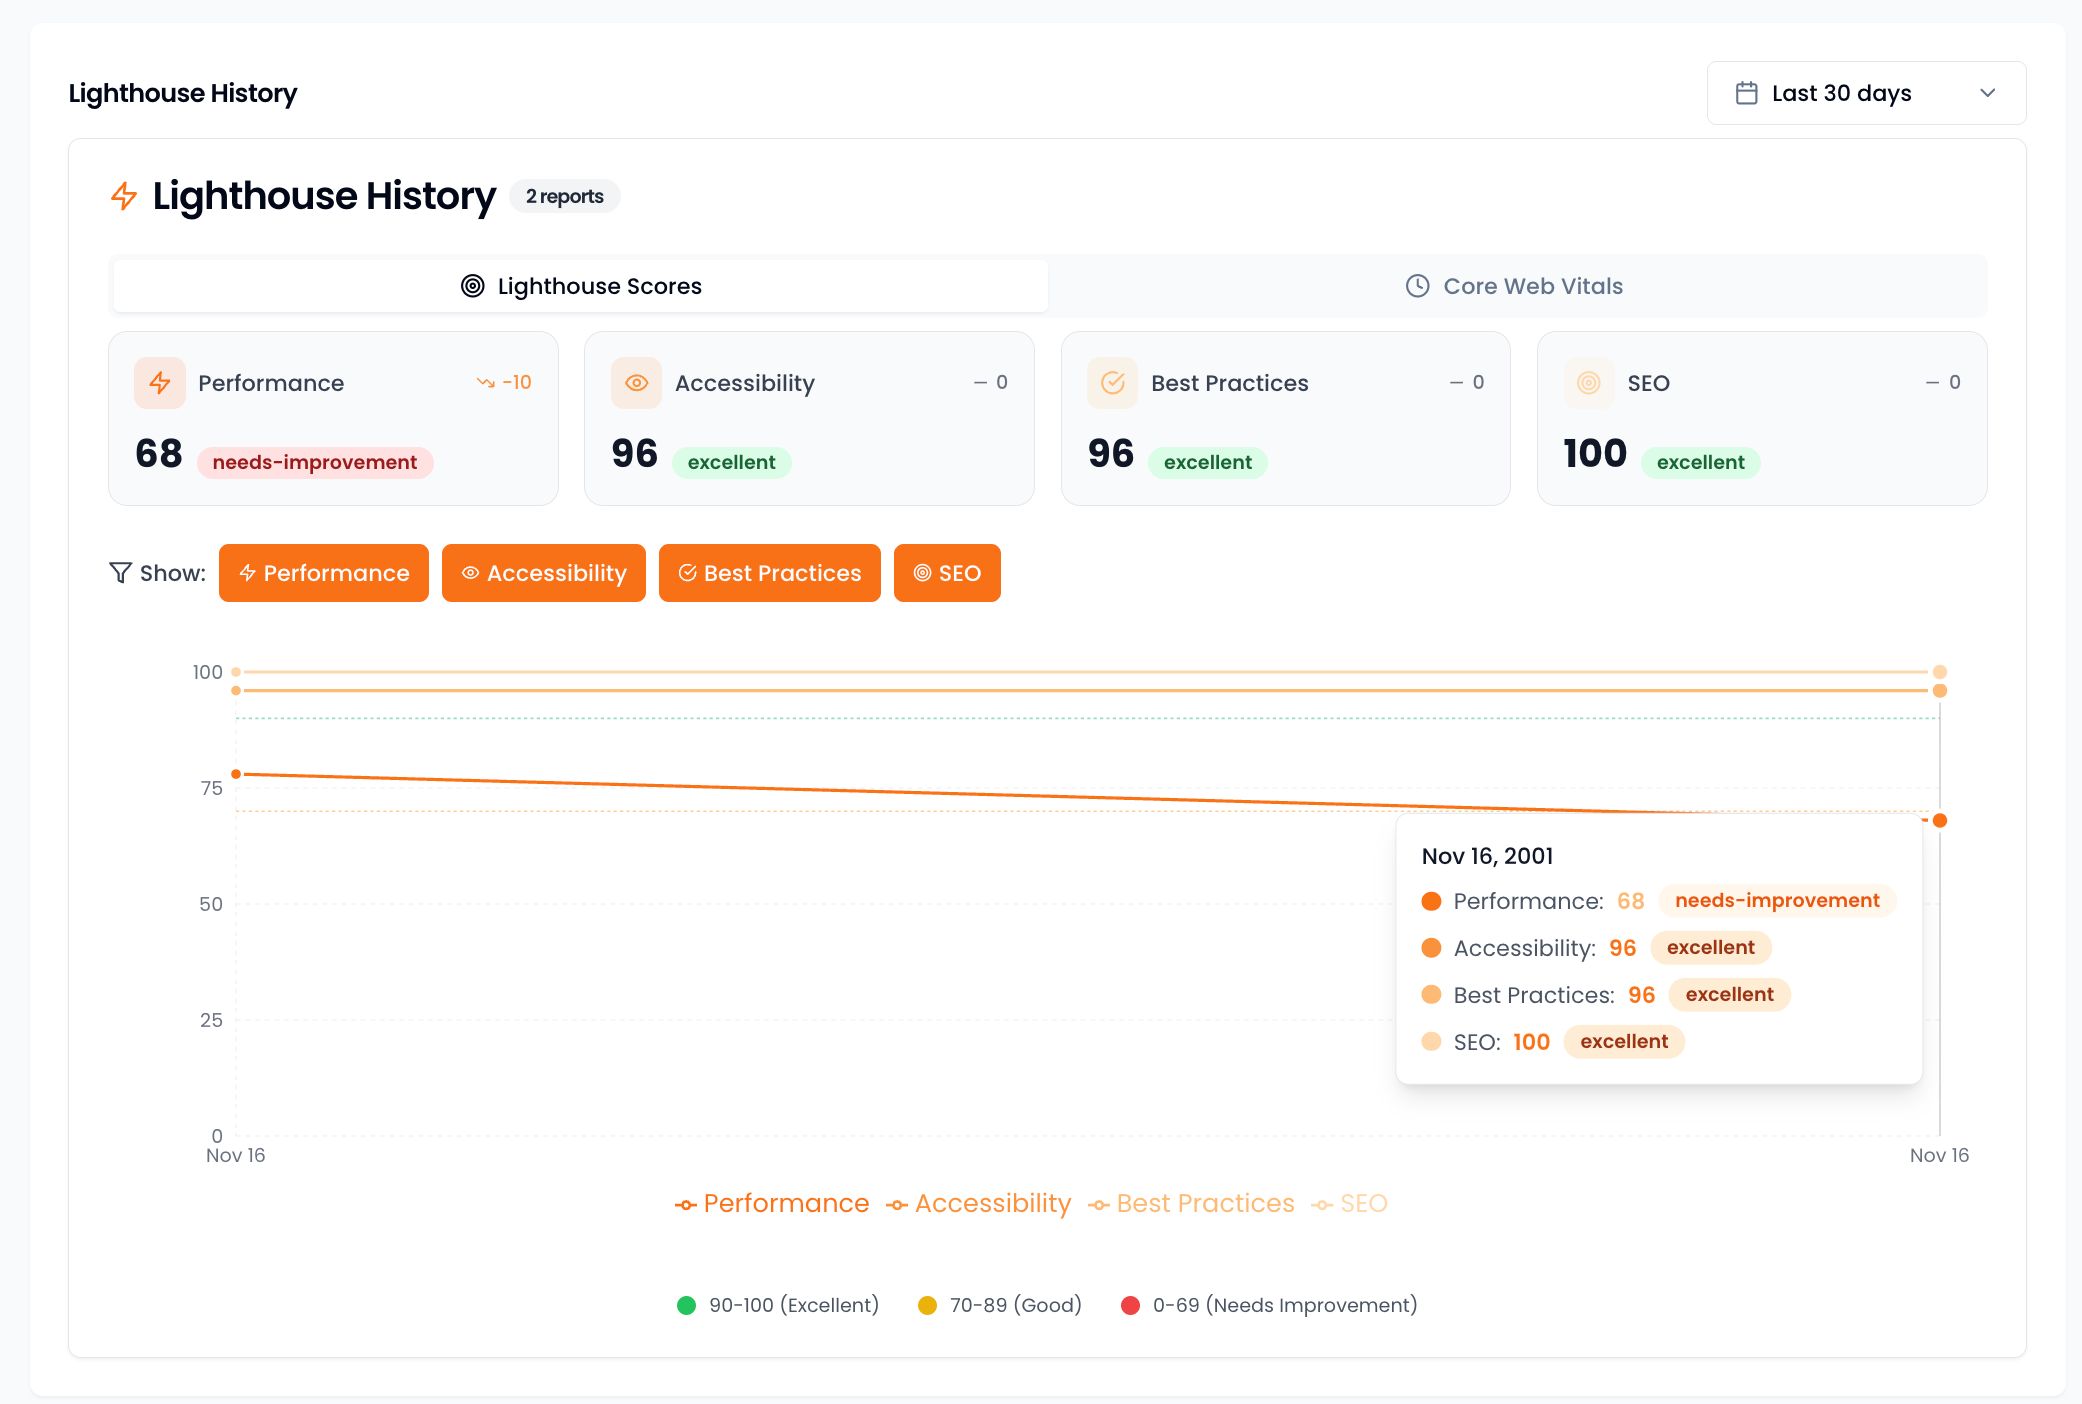
So how do you know if your website is fast or slow? How do you find out what is making it slow? This is where Google Lighthouse comes in.
Google Lighthouse is like a report card for your website. It looks at your website and tells you exactly what grade you get and what you need to improve. Best of all, it is completely free to use.
In this guide, we are going to learn everything about Lighthouse from the very beginning. By the end, you will understand exactly how to check your website's speed and how to fix any problems you find.
Part 1: What is Google Lighthouse?
Understanding Lighthouse at Its Core
Google Lighthouse is a tool made by Google that checks how good your website is. Think of it like a teacher who looks at your homework and tells you what you did well and what you need to fix.
When you run Lighthouse on your website, it does not just check one thing. It checks many different things and gives you a score for each one. These scores help you understand where your website needs the most work.
The Five Things Lighthouse Checks
Lighthouse divides its report card into five main sections. Let us go through each one so you understand what they mean.
1. Performance: How Fast Does Your Website Load?
This is the most important section. Performance measures how quickly your website shows up on someone's screen and how quickly they can start using it.
Think about opening an app on your tablet. Some apps open instantly and you can start playing right away. Other apps show a loading screen for what feels like forever. Performance measures this exact thing for websites.
Google cares about this section the most because users hate waiting. A perfect performance score is 100, but even getting to 90 or above is considered excellent.
2. Accessibility: Can Everyone Use Your Website?
Not everyone uses websites the same way. Some people cannot see well and use special programs called screen readers that read the website out loud to them. Some people cannot use a mouse and need to navigate using only their keyboard.
Accessibility checks if your website works for everyone, including people with disabilities. This is important because everyone deserves to be able to use the internet, and in some places, it is actually the law that websites must be accessible.
3. Best Practices: Is Your Website Built the Right Way?
This section checks if your website follows the rules that all good websites should follow. For example, it checks if your website uses secure connections (the little lock icon you see in your browser), if your images are the right size, and if there are any errors in your code.
If your images are not in proper size, you can always resize them using one of our tools.
Think of this like checking if you followed the instructions when building something with building blocks. Even if it looks okay, you want to make sure you did it the proper way so it does not fall apart later.
4. SEO: Can Search Engines Find Your Website?
SEO stands for Search Engine Optimization. This section checks if Google and other search engines can easily understand what your website is about.
Imagine you wrote a really good story but forgot to put your name on it and did not give it a title. Your teacher would not know whose story it is or what it is about. SEO makes sure your website has all the information that search engines need to show it to the right people.
5. Progressive Web App: Can Your Website Work Like an App?
This section checks if your website can work like an app on someone's phone. Some websites can be installed on your home screen and even work when you do not have internet. This section checks for those features.
This is the least important section for most websites, so do not worry too much about it unless you specifically want your website to work like an app.
The Key Takeaway
Out of all five sections, Performance is the one you should focus on first. This is because Google uses your performance score to decide how high to rank your website in search results. A faster website means more people will find you on Google.
Part 2: How to Run a Lighthouse Test
Now that you know what Lighthouse checks, let us learn how to actually run a test on your website. There are three main ways to do this.
Method 1: Using Chrome DevTools
This is the fastest and easiest way to run a Lighthouse test. You do not need to install anything because it is already built into the Google Chrome browser.
Here is how to do it step by step:
Step 1: Open Google Chrome on your computer. If you do not have Chrome, you will need to download it first because Lighthouse only works in Chrome.
Step 2: Go to the website you want to test. Type the address in the address bar and press Enter.
Step 3: Right-click anywhere on the page and select "Inspect" from the menu that appears. A panel will open on the side or bottom of your screen with lots of code and tabs.
Step 4: Look at the tabs at the top of this panel. You will see things like "Elements", "Console", and "Network". Look for a tab that says "Lighthouse". You might need to click a little arrow to see more tabs if Lighthouse is hidden.
Step 5: Once you click on Lighthouse, you will see some options. Here is what you need to select:
- Device: Choose "Mobile". Google looks at the mobile version of websites first, so this is what matters most.
- Categories: You can check all of them, but make sure "Performance" is definitely checked.
- Mode: Keep it on "Navigation (Default)".
Step 6: Click the button that says "Analyze page load". Now wait. Lighthouse will reload your website and run lots of tests. This usually takes about 30 to 60 seconds.
Step 7: When it is done, you will see your report with scores for each category.
Method 2: Using PageSpeed Insights Website
PageSpeed Insights is a website made by Google that runs Lighthouse for you. The special thing about this method is that it shows you two types of data.
The first type is called Lab Data. This is the test that Lighthouse just ran on your website. It is like a snapshot of how your website performed right now.
The second type is called Field Data. This is much more important. Field Data shows how real people have experienced your website over the past 28 days. Google collects this information from people who use Chrome and have agreed to share their data.
Here is why Field Data matters so much: When Google decides how to rank your website, it uses Field Data, not Lab Data. So even if your Lab Data looks good, what really counts is how real users experience your site.
To use PageSpeed Insights:
Step 1: Go to pagespeed.web.dev in your browser.
Step 2: Type your website address in the box and click "Analyze".
Step 3: Wait for the test to finish. You will see both your Lab Data (Lighthouse results) and your Field Data (real user experience).
If your Field Data shows red or orange scores, that is what you need to fix. These are the numbers Google actually cares about.
Method 3: Using Automated Monitoring Tools
Running tests manually is fine when you are just getting started, but it becomes a problem as your website grows. Here is why:
Imagine you add a new image to your website, but the image is huge and not optimized. Your website is now slower, but you might not realize this for weeks until you remember to run another Lighthouse test.
Automated monitoring tools solve this problem by running Lighthouse tests for you automatically, like every day or every week. If your score drops, you get an alert so you can fix the problem right away.
Some popular options include:
- Free: You can set up automated tests using something called a CI/CD pipeline. This is more technical but very powerful.
- Paid Services: There are many services that will monitor your website for you and send you reports. These are easier to use but cost money.
For anyone serious about their website's performance, some form of automated monitoring is essential. You cannot fix problems you do not know about.
Part 3: Understanding Your Performance Score
When you run a Lighthouse test, the Performance score you see is not just a random number. It is calculated based on several different measurements that Lighthouse takes. Let us break down the most important ones.
Core Web Vitals: The Three Most Important Measurements
Google has decided that three specific measurements are the most important for determining if a website provides a good experience. They call these the Core Web Vitals. If you fix nothing else, fix these three things.
Core Web Vital 1: Largest Contentful Paint (LCP)
What it measures: How long it takes for the biggest thing on your page to show up.
Let me explain this in a simple way. When you go to a website, the page does not appear all at once. First you might see some text, then some small images, then finally the big hero image or main headline at the top.
LCP measures how long it takes for that biggest piece of content to appear. This is usually a large image at the top of the page, a video, or a big block of text.
Why it matters: Users judge how fast a website is by when they see the main content. If the big stuff takes forever to show up, they think the site is slow, even if small things loaded quickly.
What is a good score: Your LCP should be 2.5 seconds or less. If it takes longer than 4 seconds, it is considered poor.
What makes LCP slow:
- Your web server is slow to respond
- The main image is too large and not optimized
- Other files are blocking the page from loading
Think of it like this: You ordered a pizza. LCP measures how long until you see the pizza box arrive. If the delivery person is slow, or if they bring other things first and the pizza comes last, your LCP will be bad.
Core Web Vital 2: First Input Delay (FID) and Total Blocking Time (TBT)
What it measures: How quickly your website responds when someone tries to do something.
Imagine you click a button on a website but nothing happens for a few seconds. Then suddenly it works. That delay is what FID measures. It is the time between when you click and when the website starts responding.
Now here is something tricky: FID can only be measured with real users. Lighthouse cannot measure it in a lab test. So instead, Lighthouse measures something called Total Blocking Time (TBT), which is very similar and helps you fix the same problems.
Why it matters: When people click on something, they expect it to respond immediately. Even a small delay makes the website feel broken or cheap.
What is a good score:
- FID should be under 100 milliseconds (that is one tenth of a second)
- TBT should be under 300 milliseconds
What makes it slow: Almost always, the problem is too much JavaScript code running. JavaScript is the code that makes websites interactive, but if there is too much of it, or if it is not written efficiently, it blocks the browser from responding to your clicks.
Think of it like this: You ask your friend a question, but they are busy doing math homework. They cannot answer you until they finish the math problem. If the math problem is really long, you have to wait a long time. JavaScript works the same way - if it is doing a lot of work, it cannot respond to your clicks.
Core Web Vital 3: Cumulative Layout Shift (CLS)
What it measures: How much things move around on the page while it is loading.
Have you ever tried to click a button on a website, but right as you clicked, the whole page shifted and you clicked on something else? Maybe an ad loaded and pushed everything down. This is incredibly frustrating.
CLS measures how much the content jumps around while the page is loading. A page with low CLS stays still and stable. A page with high CLS is like trying to read a book while someone keeps shaking it.
Why it matters: Layout shifts are annoying and can cause people to accidentally click on the wrong things.
What is a good score: Your CLS should be under 0.1. If it is over 0.25, it is considered poor.
What makes it bad:
- Images without width and height specified
- Ads that load late and push content down
- Fonts that load late and change the size of text
- Content that gets added to the page by JavaScript after the page loads
Think of it like this: You are reading a comic book, but someone keeps inserting new panels in the middle of the page, pushing everything else around. You lose your place every time. That is what bad CLS feels like.
How These Measurements Connect
Here is an important thing to understand: These three measurements work together to create the overall user experience.
- LCP tells you if the page loads fast enough
- FID/TBT tells you if the page responds fast enough
- CLS tells you if the page stays stable
You need all three to be good for users to have a great experience. A page that loads fast but shifts around a lot is still frustrating. A page that is stable but does not respond to clicks is still broken.
Google combines your scores on these three measurements into your overall Core Web Vitals assessment. If all three are good, you pass. If any of them fail, you fail.
Part 4: How to Fix LCP Problems (Making Your Page Load Faster)
LCP is usually the first thing people need to fix because it has the biggest impact on how fast your website feels. Let us go through the main ways to improve it.
Fix 1: Make Your Server Respond Faster
Before your website can even start loading, the server needs to respond to the request. The time this takes is called Time to First Byte (TTFB).
What is happening: When you type a website address and press Enter, your browser sends a message to the server asking for the website. The server has to receive this message, figure out what to send back, and then send it. If the server is slow, everything else has to wait.
How to fix it:
Upgrade your hosting: The cheapest hosting plans put hundreds of websites on the same server. This is like having 100 people share one kitchen - everything takes forever. Moving to a better hosting plan gives you more resources and faster response times.
Use a Content Delivery Network (CDN): A CDN copies your website to servers all around the world. When someone visits your site, they get the copy from the server closest to them, which is much faster than always getting it from one place. Popular CDNs include Cloudflare (which has a free plan) and AWS CloudFront.
Optimize your database: If your website uses a database (like WordPress sites do), slow database queries can make your server respond slowly. This usually requires a developer to fix, but it can make a huge difference.
Target: Your TTFB should be under 200 milliseconds
Fix 2: Optimize Your Main Image
The LCP element is usually a large image at the top of your page. If this image is not optimized, your LCP will be terrible.
What is happening: Large images take longer to download. If your hero image is 3 megabytes, it has to travel from the server to the user's browser, and that takes time. This is especially bad on mobile phones with slower internet connections.
How to fix it:
Use modern image formats: Old image formats like JPEG and PNG are not very efficient. Modern formats like WebP can make images 25-35% smaller with no loss in quality. Almost all browsers now support WebP.
If you need help converting your images to WebP format, you can use the Image to WebP Converter to quickly convert your images without losing quality.
Compress your images: Even if you use WebP, you should still compress your images to make them as small as possible. There are many tools that can do this automatically.
For compressing images while maintaining visual quality, the Image Compressor tool can help you reduce file sizes significantly.
Use the right size: If your image displays at 800 pixels wide, do not upload an image that is 4000 pixels wide. Resize it to the size it will actually be displayed at.
Specify dimensions: Always include width and height attributes on your images. This helps the browser know how much space to reserve before the image loads.
Here is an example of how to include an image properly:
<img
  src="hero-image.webp"
  width="1200"
  height="600"
  alt="Description of image"
/>
Fix 3: Eliminate Render-Blocking Resources
Before the browser can show your page, it has to download and process certain files. If these files are large or slow, they block everything from appearing.
What is happening: The two main types of files that block rendering are CSS and JavaScript. The browser stops and waits for these files to load before showing anything on the page. This is called being render-blocking.
How to fix it:
Inline critical CSS: Critical CSS is the styling needed for the content that appears first on the page (called above-the-fold content). Instead of putting this in a separate file that has to be downloaded, you put it directly in the HTML. This way, the browser has it immediately.
Defer JavaScript: Most JavaScript does not need to run before the page appears. You can tell the browser to download it but wait to run it until after the page loads. You do this by adding the word "defer" to your script tag:
<script defer src="your-script.js"></script>
Load CSS asynchronously: For CSS that is not needed for the initial view, you can load it in a way that does not block the page.
Fix 4: Preload Important Resources
Sometimes the browser does not know that something is important until it is too late. You can give it hints to download certain things earlier.
What is happening: The browser reads your HTML from top to bottom and downloads things as it finds them. But sometimes the most important thing, like your LCP image, is not discovered until later.
How to fix it:
Use the preload tag to tell the browser to download important things right away:
<link rel="preload" href="hero-image.webp" as="image" />
<link
  rel="preload"
  href="important-font.woff2"
  as="font"
  type="font/woff2"
  crossorigin
/>
This goes in the head section of your HTML and tells the browser: "Hey, you are going to need these soon, so start downloading them now."
Part 5: How to Fix TBT/FID Problems (Making Your Page Respond Faster)
If your Total Blocking Time is high, it means too much JavaScript is running and blocking the browser from responding to user input. Here is how to fix it.
Understanding Main Thread Blocking
To understand TBT, you need to understand how browsers work. Your browser has something called the main thread, which is like the brain of the browser. It can only do one thing at a time.
When JavaScript runs, it uses the main thread. While JavaScript is running, the main thread cannot do anything else - including responding to your clicks. This is why heavy JavaScript makes websites feel unresponsive.
The goal is to reduce how much work the main thread has to do, or at least break the work into smaller pieces so the browser can respond between them.
Fix 1: Reduce the Amount of JavaScript
The most effective fix is simply to use less JavaScript.
What is happening: Many websites load tons of JavaScript they do not actually need. Maybe there is a library for animations that is not used, or three different analytics tools tracking the same things, or a chat widget that nobody uses.
How to fix it:
Audit your JavaScript: Look at everything that is being loaded and ask: Do we actually need this? You might be surprised how much you can remove.
Remove unused code: Modern build tools can automatically remove code that is never used. This is called tree-shaking. If you are using a tool like Webpack or Rollup, make sure tree-shaking is enabled.
Split your code: Instead of loading all your JavaScript at once, split it into smaller pieces and only load what you need for each page. This is called code splitting.
Fix 2: Defer Non-Critical JavaScript
Even if you need certain JavaScript, you might not need it immediately.
What is happening: By default, JavaScript blocks the browser while it downloads and runs. But many scripts, like analytics or social media buttons, are not needed until after the page is visible and interactive.
How to fix it:
Use defer: As mentioned earlier, the defer attribute tells the browser to download the script but wait to run it until after the HTML is fully loaded:
<script defer src="analytics.js"></script>
Use async carefully: The async attribute tells the browser to download the script without blocking, but it runs as soon as it is downloaded. This can still block the main thread if it runs at a bad time. Use async only for scripts that are completely independent and do not need to run in any particular order.
Load after interaction: Some scripts do not need to load until the user does something. For example, a chat widget could load only when the user clicks a chat button.
Fix 3: Minimize Third-Party Scripts
Third-party scripts are scripts that come from other websites and services. They are often the biggest source of TBT problems.
What is happening: Every time you add a chat widget, a social media button, an analytics tool, or an advertising pixel, you are adding JavaScript that you do not control. These scripts can be huge and poorly optimized, and they all add up.
How to fix it:
Be selective: Only use third-party services you actually need. Every widget and tracking pixel has a cost.
Host fonts locally: If you use Google Fonts or other web fonts, they load from Google's servers, which adds delay. You can download the font files and host them on your own server instead.
Use a tag manager: If you have many tracking scripts, a tag manager lets you control when they load. You can set them to load after the page is interactive, which prevents them from blocking the main thread during the critical loading phase.
Delay advertising scripts: Ads are often the heaviest scripts. If possible, load them after the user has started interacting with the page.
Fix 4: Break Up Long Tasks
The browser considers any task that takes more than 50 milliseconds to be a long task. Long tasks are bad because they block the main thread for too long.
What is happening: If you have a JavaScript function that takes 200 milliseconds to run, the browser cannot respond to clicks or update the screen for that entire 200 milliseconds. Users will notice this as lag or unresponsiveness.
How to fix it:
Split large tasks: Instead of doing everything in one big function, break it into smaller pieces. Run a little bit, then give the browser a chance to do other things, then run the next piece.
This is an advanced technique that usually requires developer help, but it can make a big difference for JavaScript-heavy applications.
Part 6: How to Fix CLS Problems (Making Your Page Stable)
Layout shift is one of the most annoying problems for users, but it is often one of the easiest to fix. The key is to make sure the browser knows the size of everything before it loads.
Understanding Why Shifts Happen
The browser needs to know how much space each element takes up so it can arrange the page. When an element's size is unknown, the browser guesses. Then when the element loads and it is a different size than the guess, everything has to move to make room.
Think of it like setting a table for dinner. If you do not know how big the serving dish is going to be, you might not leave enough room for it. When the dish arrives, you have to move everything around.
Fix 1: Always Set Dimensions on Images and Videos
This is the most common cause of CLS and the easiest to fix.
What is happening: When you include an image without specifying its width and height, the browser does not know how big it will be. It leaves no space for it. Then when the image loads, everything below it gets pushed down.
How to fix it:
Always include width and height attributes on images:
<img src="photo.jpg" width="800" height="600" alt="Description" />
For responsive images that change size, you can use CSS to make them flexible while still specifying the aspect ratio:
img {
  width: 100%;
  height: auto;
  aspect-ratio: 4/3;
}
This tells the browser: "The image will fill its container's width, and its height should be calculated to maintain a 4:3 aspect ratio."
For videos, the same rule applies. Always specify dimensions.
Fix 2: Reserve Space for Ads and Embeds
Ads and embedded content like YouTube videos are notorious for causing layout shifts.
What is happening: An ad network decides what ad to show you, and different ads have different sizes. The browser does not know what size the ad will be until it loads. Same with embedded content like videos or social media posts.
How to fix it:
Create a container with a fixed size: Instead of letting the ad determine its own size, put it in a container that has a set width and height:
<div style="width: 300px; height: 250px;">
  <!-- Ad code goes here -->
</div>
Now even if the ad is a different size, it stays within this container and does not push anything around.
Reserve space for empty slots: Sometimes an ad does not load at all. If you do not reserve space for it, the layout will shift when it becomes clear no ad is coming. Keep the placeholder space even when empty.
Use aspect ratio for responsive embeds: For things like YouTube videos that need to be responsive, use the aspect ratio technique:
<div style="aspect-ratio: 16/9;">
  <iframe src="youtube-video-url" style="width: 100%; height: 100%;"></iframe>
</div>
Fix 3: Handle Web Fonts Properly
Custom fonts can cause layout shifts in two ways: They can make text invisible while loading (FOIT - Flash of Invisible Text) or they can make text jump when the font swaps in (FOUT - Flash of Unstyled Text).
What is happening: When you use a custom font, the browser has to download it. While it is downloading, the browser has to decide what to do with the text. Some browsers hide it, some show it in a fallback font. Either way, when the custom font loads, things might shift.
How to fix it:
Use font-display: swap: This CSS property tells the browser to show text immediately in a fallback font, then swap to the custom font when it loads. This prevents invisible text but can cause a small shift:
@font-face {
  font-family: "Custom Font";
  src: url("custom-font.woff2") format("woff2");
  font-display: swap;
}
Match fallback font metrics: The shift happens because the fallback font is a different size than the custom font. If you adjust the fallback font to be closer in size, the shift will be smaller. There are tools that can help you calculate these adjustments.
Preload fonts: Download fonts as early as possible so they are ready when needed:
<link
  rel="preload"
  href="custom-font.woff2"
  as="font"
  type="font/woff2"
  crossorigin
/>
Fix 4: Do Not Insert Content Above Existing Content
Sometimes JavaScript adds new content to the page after it loads. If this content appears above things that are already visible, everything gets pushed down.
What is happening: A common example is a cookie consent banner that appears at the top of the page. Or a promotional bar that gets added above the header. These push everything down and cause layout shift.
How to fix it:
Insert at the bottom or use overlays: If you need to add content dynamically, add it at the bottom of the viewport or use a fixed overlay that does not push other content around.
Reserve space: If you know a banner will appear at the top, reserve space for it from the beginning, even if it is empty at first.
Animate in from top: Instead of pushing content down, you can have the banner slide in as an overlay on top of existing content.
Part 7: General Performance Optimizations
Beyond the Core Web Vitals, there are several other optimizations that improve overall performance.
Enable Text Compression
Text files like HTML, CSS, and JavaScript can be compressed to make them much smaller.
What is happening: Compression algorithms like GZIP and Brotli find patterns in your text files and replace them with shorter codes. This can reduce file sizes by 70-80%.
How to fix it:
This is configured on your web server, not in your code. You need to enable GZIP or Brotli compression for text-based file types. If you use a CDN, this is often enabled by default.
Brotli is newer and compresses better than GZIP, but it needs more processing power. Most modern hosting and CDN services support both.
Implement Browser Caching
When someone visits your website, their browser downloads your files. If they visit again, why download everything again?
What is happening: Browser caching tells the browser to save files and reuse them on future visits instead of downloading them again. This makes subsequent page loads much faster.
How to fix it:
Set Cache-Control headers on your server responses for static files like images, CSS, and JavaScript. A typical setting is:
Cache-Control: max-age=31536000
This tells the browser to keep the file for one year (31,536,000 seconds). When you need to update a file, you change its name (like adding a version number) so the browser knows to download the new version.
Minify Your Code
Minification removes unnecessary characters from your code without changing what it does.
What is happening: Your CSS and JavaScript files have things like spaces, line breaks, and comments that make them easier for humans to read. Browsers do not need any of that. Minification removes it all, making the files smaller.
How to fix it:
Most build tools and content management systems have minification built in or available as a plugin. You should be minifying:
- HTML
- CSS
- JavaScript
The savings are usually 10-30% on top of compression.
Lazy Load Images Below the Fold
If an image is not visible when the page first loads, why download it immediately?
What is happening: By default, browsers download all images on a page as soon as they discover them. But if an image is far down the page, the user might never scroll there. Lazy loading delays downloading these images until they are needed.
How to fix it:
Add the loading="lazy" attribute to images that are not visible when the page first loads:
<img src="photo.jpg" loading="lazy" alt="Description" />
Important: Do NOT lazy load your LCP image (the main image at the top of the page). That image needs to load as fast as possible.
Modern browsers support native lazy loading, so you do not need any JavaScript libraries for this.
Part 8: Understanding Different Types of Websites
Different types of websites have different performance challenges. Here is what to focus on for common website types.
E-commerce Stores
Online stores usually struggle with TBT because of all the tracking scripts, analytics, and third-party integrations they use.
Main problems:
- Many tracking pixels and analytics tools
- Product image galleries with lots of images
- Complex checkout processes with lots of JavaScript
Priority fixes:
- Optimize product images using modern formats and compression
- Lazy load images that are not visible immediately
- Defer all tracking scripts to load after the page is interactive
- Simplify the checkout process to use less JavaScript
Content and News Websites
Blogs and news sites usually have problems with CLS because of ads that load late and push content around.
Main problems:
- Advertisement slots that shift content when ads load
- Lots of images in articles
- Embedded videos and social media posts
Priority fixes:
- Reserve specific sizes for all ad slots
- Set dimensions on all images in articles
- Use aspect ratio containers for embedded videos
- Lazy load images that are not at the top of the article
Corporate and Landing Pages
These sites often have LCP problems because of large hero images and custom fonts.
Main problems:
- Large hero images at the top of the page
- Custom web fonts that take time to load
- Animations and visual effects that use JavaScript
Priority fixes:
- Optimize the hero image aggressively and preload it
- Implement critical CSS so the above-the-fold content can render immediately
- Use font-display: swap and preload your fonts
- Defer animations until after the page is interactive
Part 9: Measuring the Business Impact
Improving Lighthouse scores is not just about getting a higher number. The real goal is improving your business results. Here is how to measure the impact.
Metrics to Track
Conversion Rate: This is the percentage of visitors who take a desired action, like signing up or making a purchase. Faster sites have higher conversion rates.
Bounce Rate: This is the percentage of visitors who leave after seeing only one page. High bounce rates often indicate performance problems - people are leaving because the site is too slow.
Organic Traffic: This is how many people find you through search engines. As your Core Web Vitals improve, your search rankings may improve, bringing more organic traffic.
Revenue per Session: For e-commerce sites, track how much money you make per visit. Faster sites typically see higher revenue per session.
How to Measure
Before you start optimizing, document your current metrics:
- Run Lighthouse and record your scores
- Check your analytics for conversion rate, bounce rate, and traffic
- Note the date
After implementing fixes:
- Run Lighthouse again and compare scores
- Wait 2-4 weeks for analytics data to accumulate
- Compare your business metrics to the baseline
You might not see immediate results. It takes time for Google to re-crawl your site and update rankings, and it takes time for your analytics to reflect the changes. Be patient.
Setting Performance Budgets
A performance budget is a limit you set for yourself. For example:
- LCP must be under 2.5 seconds
- Total JavaScript must be under 300 KB
- Performance score must be above 90
If any change to your website would break these budgets, you do not make that change (or you find a way to make it without breaking the budget).
Performance budgets help you maintain your gains over time instead of slowly degrading.
Part 10: Creating a Performance Culture
Optimizing your website once is not enough. Performance is an ongoing effort because websites change constantly.
Why Performance Degrades
Every time you add something to your website, you potentially make it slower:
- A new image that is not optimized
- A new third-party script
- A new feature that requires more JavaScript
- Content that does not have dimensions specified
Without ongoing monitoring, these small additions accumulate until your site is slow again.
Setting Up Continuous Monitoring
The solution is to monitor your performance continuously and catch problems early.
Automated testing: Set up automated Lighthouse tests that run regularly, like once a day or after every change to your website. If the score drops, you get alerted.
Real User Monitoring (RUM): This tracks actual user experiences on your website. It tells you your real Core Web Vitals scores based on how actual visitors experience your site.
Regular audits: Even with automation, it helps to do a thorough manual audit every few months to find optimization opportunities. seoinsights helps you monitor the selected pages every week!
Making It a Team Effort
Performance cannot be just one person's responsibility. Everyone who works on the website needs to think about performance:
Designers need to consider file sizes when choosing images and fonts.
Developers need to think about the impact of new code on load times.
Content creators need to optimize images and avoid adding unnecessary embeds.
Marketing needs to evaluate whether each new tracking script is worth the performance cost.
When everyone cares about performance, it becomes much easier to maintain.
Conclusion: Your Path to a Faster Website
Google Lighthouse is not just a tool for getting a score. It is a guide that shows you exactly how to build a better website. A faster website means happier users, better search rankings, and more conversions.
Let us recap the key points:
Start with Core Web Vitals: These three metrics (LCP, FID/TBT, CLS) are what Google uses to rank your site. Focus on them first.
LCP (Load Speed): Make sure your main content loads fast by optimizing images, improving server response, and eliminating render-blocking resources.
TBT/FID (Interactivity): Make sure your site responds to clicks quickly by reducing JavaScript, deferring non-critical scripts, and minimizing third-party code.
CLS (Visual Stability): Make sure your page does not jump around by specifying image dimensions, reserving space for ads, and handling fonts properly.
One change at a time: Do not try to fix everything at once. Make one change, run the test, see the impact. This helps you understand what works.
Monitor continuously: Set up automated testing so you know immediately when performance degrades.
Make it a habit: Performance is not a one-time project. Make it part of how you build and maintain your website.
The difference between a score of 60 and a score of 95 is the difference between losing visitors and keeping them. Every fraction of a second matters. But the good news is that the tools are free and the fixes are well documented. You just have to do the work.
Now you have all the knowledge you need to get started. Run your first Lighthouse test, identify your biggest problems, and start fixing them one by one. Your users will thank you, and so will your search rankings.
Good luck on your journey to a faster website.
Quick Reference: Performance Checklist
Use this checklist to make sure you have covered the basics:
LCP Optimization
- Server response time (TTFB) under 200ms
- LCP image is optimized and in WebP format
- LCP image is preloaded
- Critical CSS is inlined
- Non-critical JavaScript is deferred
TBT/FID Optimization
- Unused JavaScript is removed
- Code is split into smaller chunks
- Third-party scripts are minimized
- Scripts are deferred or loaded after interaction
- Long tasks are broken into smaller pieces
CLS Optimization
- All images have width and height attributes
- All videos have dimensions specified
- Ad slots have reserved space
- Web fonts use font-display: swap
- New content is not inserted above existing content
General Performance
- Text compression (GZIP/Brotli) is enabled
- Browser caching is configured
- CSS and JavaScript are minified
- Off-screen images are lazy loaded
- Images use modern formats (WebP)
Monitoring
- Automated Lighthouse tests are running
- Performance budgets are defined
- Alerts are set up for score drops
- Regular manual audits are scheduled
Work through this checklist, and you will be well on your way to a fast, high-performing website.